

Outliers are the data that is quite different from other data. They can occur for many reasons, like incorrect data entry, special events, or unusual conditions. If they are not treated, they can negatively impact your analysis and may lead to wrong statistics and conclusions. Therefore, it is quite important to deal with outliers to improve the accuracy of the conclusions drawn from the data.
Outliers matter because they can:
- Skew statistical measures such as mean and standard deviation.
- Influence model training and leads to poor predictive performance.
- Mask underlying patterns or trends in the data.
They can be very destructive to your analysis and give you a wrong impression about the results. Therefore, identifying and managing outliers is very important in achieving correct results. In this blog, we will cover:
- Types of Outliers
- Techniques for Identifying and Managing Outliers
- Strategies for Handling Outliers
- Best Practices for Identifying and Managing Outliers in Data Analysis
Types of Outliers
Understanding the types of outliers allows you to determine the right strategy to tackle them, various issues in data require different approaches to identify and treat them. Below is a broader classification I put them into:
Univariate outliers
These are data points that are located within a single variable. Univariate outliers are data points that stand out because they are very different from the rest of the values. They are often pointing to errors or rare events in the dataset. They can be easily detected using visual tools like boxplots or statistical measures like Z-scores.
Multivariate outliers
You can identify these anomalies using multi-variate(more than one variable) analysis, they’re only observed when considering more than one variable. Finding multivariate outliers helps us understand unusual patterns or relationships between multiple variables in complex data. Tools like PCA, Mahalanobis Distance or a simple scatter plot can help in detecting them.
Contextual outliers
These are unusual values that appear under specific conditions. This kind of outlier relies on the specific context of the data and needs domain knowledge to understand them correctly. For example, a seasonal item has more sales during a particular season, these can be treated by capturing seasonality in the modelling.
Collective outliers
Collective outliers don’t seem unusual when you look at individual points but become clear when you look at the data as a group. Mostly, they are used to identify issues like fraud when multiple values are different from the rest.
Example: Let’s take an example of weather reading in your city, a temperature reading of 27°C in your locality seems normal, but if the rest of the city is 33°C then the temperature in your locality is the odd one out.
Techniques for Identifying and Managing Outliers
There are many methods of identifying outliers, A few of those methods are listed below:
Data Visualization
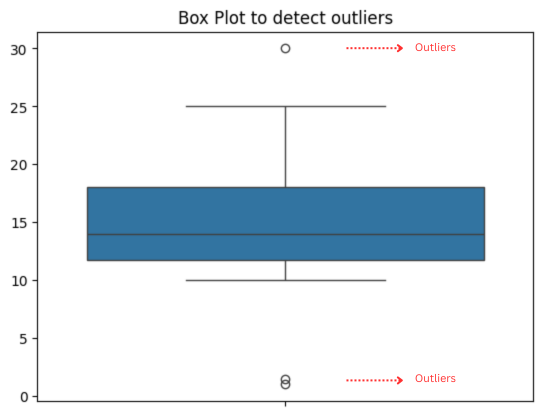
- Boxplot: It is a very powerful tool for identifying univariate outliers. For example, in a dataset of students’ exam results, a boxplot would likely yield most students with scores between 50 and 90. Yet a few respondents here and there below 30 or above 95 may be outliers.
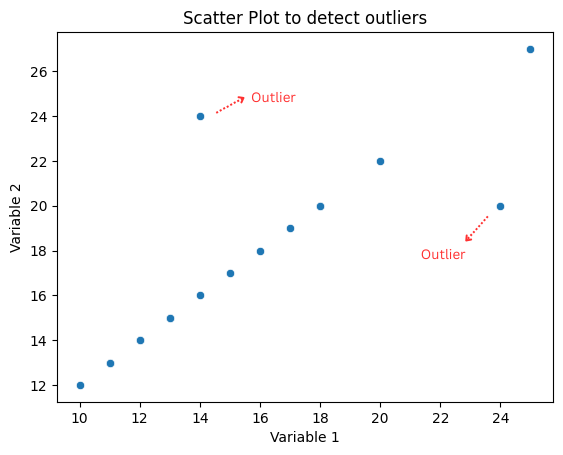
- Scatterplot: It is useful in identifying multivariate outliers. For example, in a scatter plot of the relationship between income and spending, most points will be in a straight line. If one individual is spending much more than his income, it will look like an outlier.
Statistical Methods
- Z-Scores: It is a ratio used to measure how far a value is from the mean, usually a z-score -3 to 3 indicates it is within 3 standard deviations from the mean (Be careful while using this as it assumes underlying data has normal distribution).
Example: In a certain group of employee’s monthly work hours, most employees are concentrated in the range of 140 to 180 hours. For a worker logging 240 hours in a month, this worker’s Z score might exceed 3, which would make it potentially an outlier. - IQR Rule: It is used to identify any data that is greater than the upper quartile or less than the lower quartile. For a dataset of house prices, if the IQR is₹30 lakh–₹50 lakh, any house priced below₹15 lakh or above₹75 lakh would be identified as an outlier.
Machine Learning Algorithms
- Clustering Algorithms: Unsupervised clustering algorithms such as DBSCAN will help in determining outliers, depending on the data patterns. For example, in customer segmentation, certain groups of customers might represent an irregular set of characteristics alike others.
- Isolation forests: Isolation forests are very effective for detecting outliers in high-dimensional data. For instance, on a dataset of bank transactions Isolation Forest can identify a transaction of 100 million Indian rupees in an account that normally has transactions between 10,000 and 50,000 as an outlier.
Strategies for Handling Outliers
Once the anomalies are identified, they should be treated appropriately, so that our model/analysis performance is not affected. Below are some ways they can be handled:
Remove the extreme values
This is the easiest choice, we can simply remove the extreme values that are either irrelevant or may have been entered incorrectly. For example, an age value of 200 in a customer dataset is likely erroneous and should be removed.
Although this is the easiest choice, it can be dangerous. Suppose, that when all the instances of outliers belong to a specific class in a classification problem, removing them can lead to a class imbalance, which can potentially bias the model.
Cap or Floor Values
We can set Upper and lower limits to restrict the extreme values. For instance, in a dataset set bounds for age as [0,100], then we can make values beyond the upper limit as 100.
Transform Data
Another way to minimize the impact of outliers is by applying transformations to data. For example, by applying a log transformation to the data. For instance, applying log transformation to the sales data in a restaurant can smooth out the heavy fluctuating nature of the data.
Introduce new features
Sometimes the data is not directly an error but is caused by some other effects. For example, the sudden outrage of COVID-19 has caused a massive dip in sales to all businesses. Even after re-opening the stores, the fear of COVID has put people indoors and the sales haven’t regained their shape. Instead of deleting this data, we can introduce a new feature to the model like the number of COVID cases registered etc, which can explain the low sales. By this, we can leverage the additional data when a huge set of data is abnormal.
Use Robust Models
Some models (such as decision trees) handle outliers more effectively. For instance, using Random Forests instead of linear regression can provide more reliable predictions. But be careful and do the residual analysis carefully to make sure the results are appropriate.
Best Practices for Identifying and Managing Outliers in Data Analysis
- Choose the appropriate strategy: Choosing and using the appropriate strategy depends on many factors. So make sure you think through it carefully. Remove an outlier only when there is clear reasoning behind the anomaly. Otherwise, it can lead to the loss of meaningful data points.
- Document decisions: Record the changes you made and the reasons for those changes. This helps maintain transparency and ensures your data analysis process can be easily reproduced/back-tracked.
- Test Your Strategy: Part of this step is making sure that handling improves analysis and model performance. Regularly check if your approach is effective to ensure accuracy and maintain data integrity.
Conclusion
Identifying and managing outliers may seem like a challenge, but if given a second thought and analysed properly, they can work wonders. Discover the different kinds of outliers and deal with them to improve results in your data analysis. This little step during the exploratory data analysis can improve the quality of the solution by 100% and make you a better data analyst. Start using these strategies today to uncover hidden insights in your data!